Chapter 2 Getting started
Before we start, make sure that you have opened RStudio and QGIS on your computer.
2.1 Install necessary packages
The most important packages We will be using for the GIS work are sf, raster, leaflet, and rgdal. To install these and others that we will be using, enter at the R console prompt (or copy-and-paste):
install.packages(
    c(
        "sf",
        "raster",
        "leaflet",
        "rgdal",
        "kableExtra",
        "leaflet",
        "dplyr",
        "pander",
        "knitr",
        "kableExtra",
        "tidycensus",
        "ggplot2",
        "forcats",
        "mapview"
    )
)
This should only need to be done once on any user R installation.
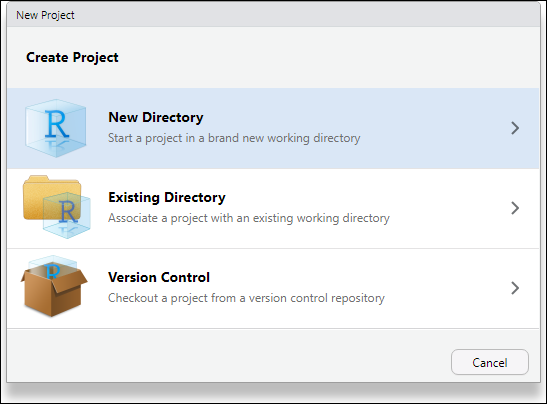
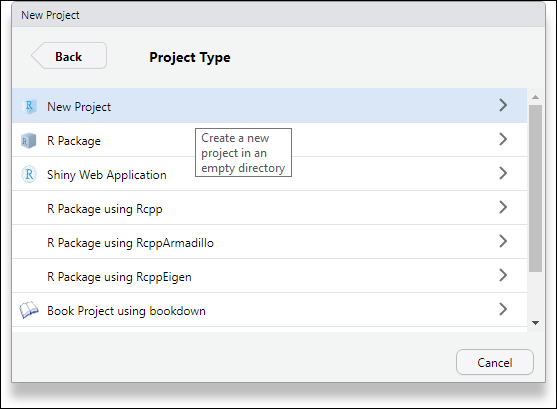
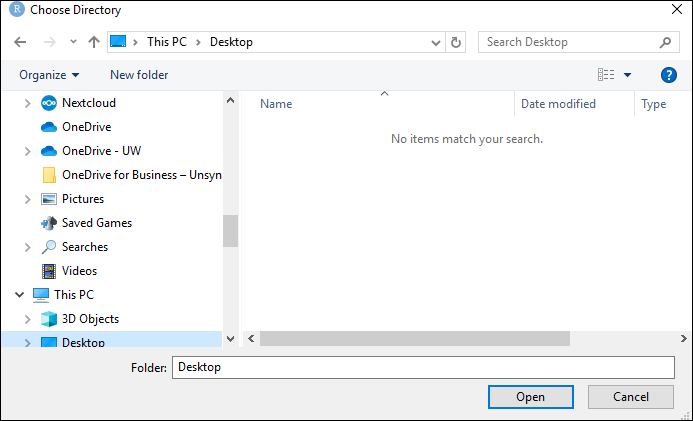
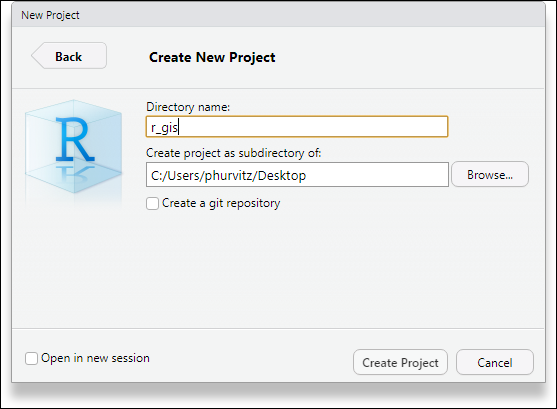
2.2 Create an RStudio project
Create a new RStudio project in a new folder on your desktop named r_gis (File > New Project).
Create a few folders
Use the Files pane and create three new folders names scripts, data, and rmd. These will be used to store various files in an organized fashion.
Create an R Markdown file_
Create a new R script (File > New File > R Markdown...)
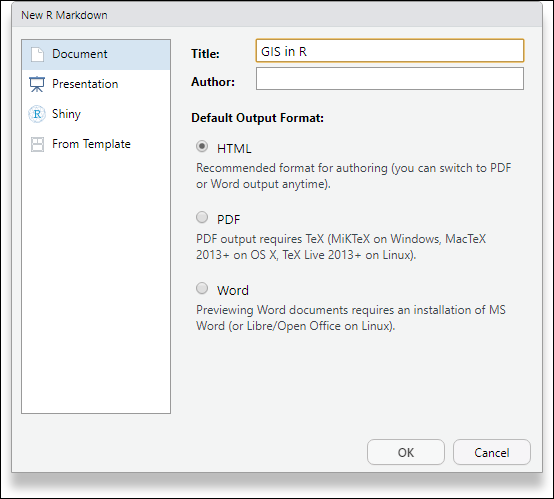
Delete most of the content
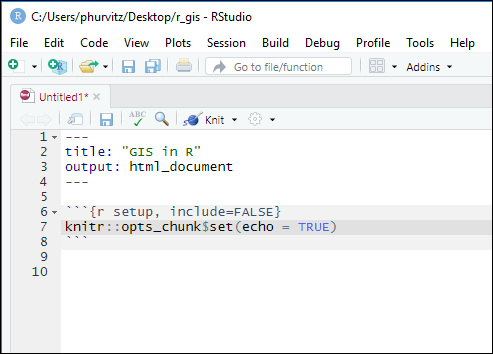
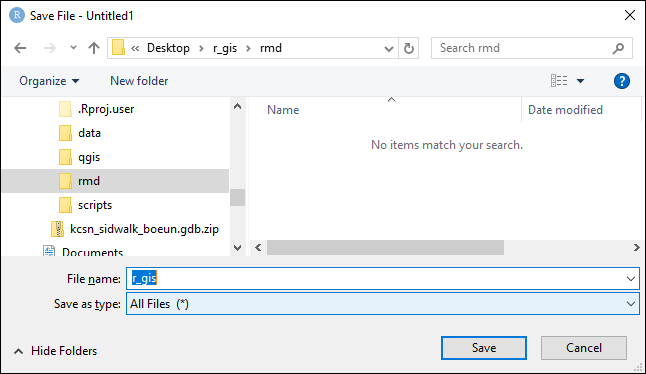
And save it as r_gis.Rmd in your rmd folder.
This is the file that will store the code for this workshop.
In the setup chunk, add these lines for the packages we will be using:
library(kableExtra)
library(knitr)
library(leaflet)
library(pander)
library(sf)
library(tidycensus)
library(ggplot2)
library(dplyr)
library(forcats)
library(mapview)
and then save the Rmd file. Continue adding to the file as we progress, by copying code chunks from this book to your Rmd file.
2.3 Download files
Download some files into the data folder you just created:
- MetroKC transportation features
- MetroKC transit stops
- KC GIS medical facilities
- KC GIS waterbodies
- Esri ZIP code polygons
- Seattle community reporting areas
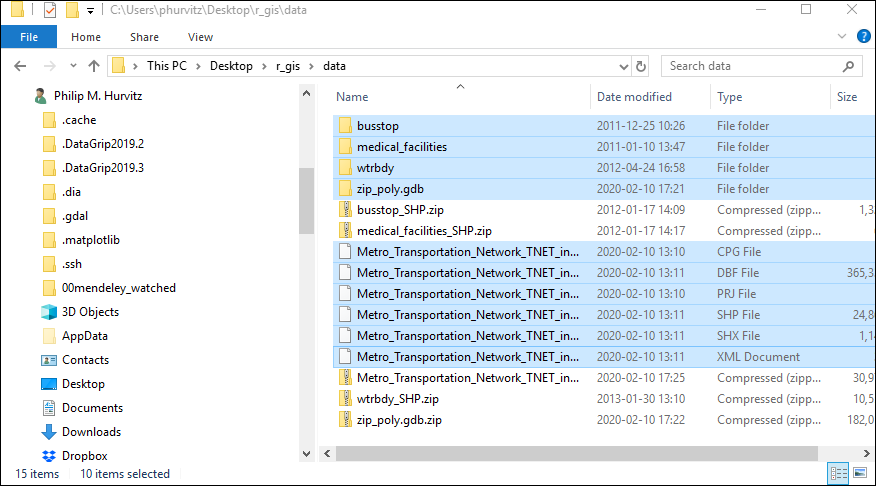
After you have downloaded the files, unzip them. The most efficient way to do this is to select all the files, R-click one of them, and then select 7-Zip > Extract Here.
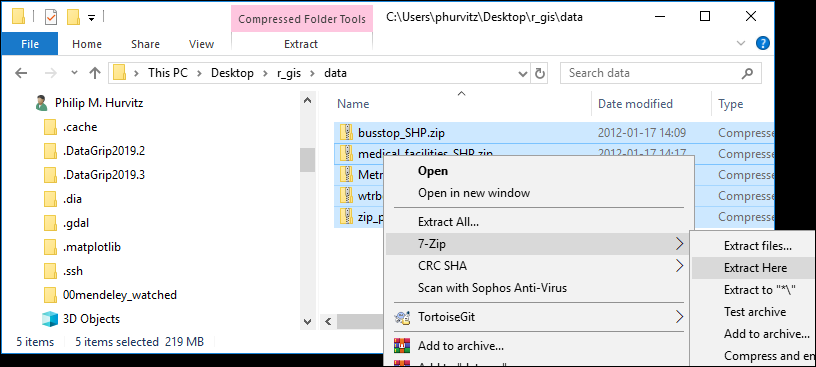
You should now have a collection of files in your data folder, including the ones you downloaded.
2.4 Preview data
In QGIS, create a new project (Project > New or use the keyboard shortcut Ctrl-N).
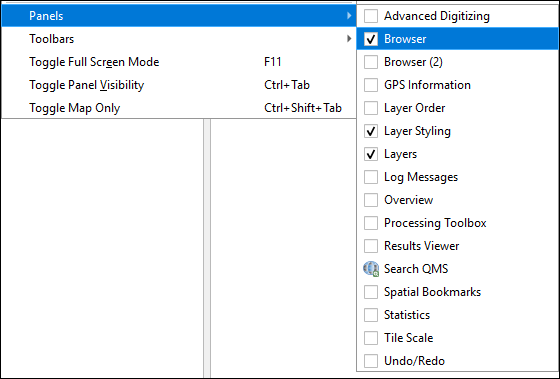
Make sure the Browser panel is available (View > PanelsBrowser). This will make it easier to add layers to the project. Also make sure theLayer Styling` panel is checked, which will enable you to quickly modify layer display properties.
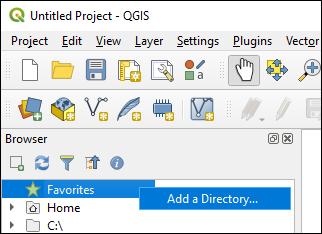
Next, make a shortcut to the data folder by R-clicking Favorites, selecting Add a Directory and navigating the the data folder.

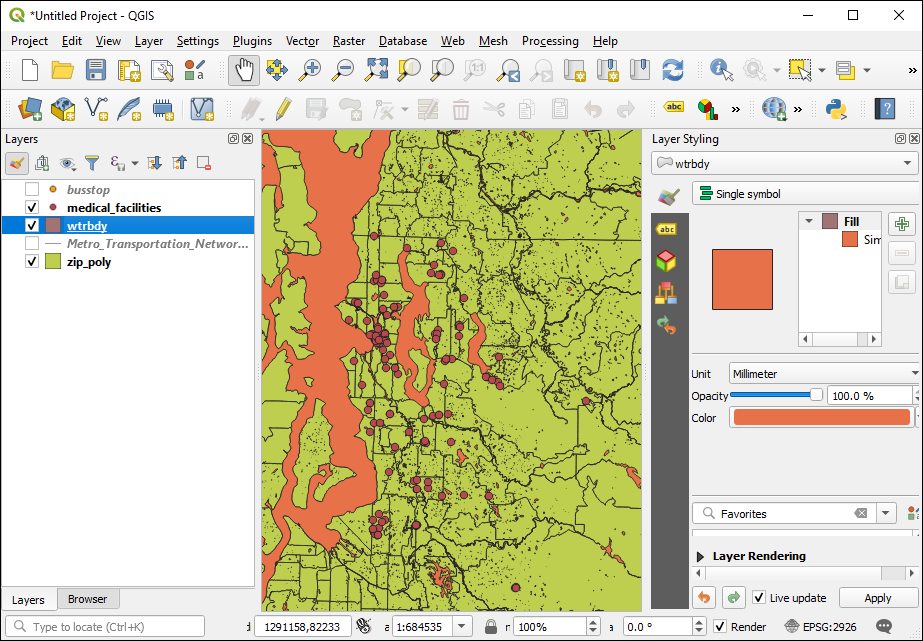
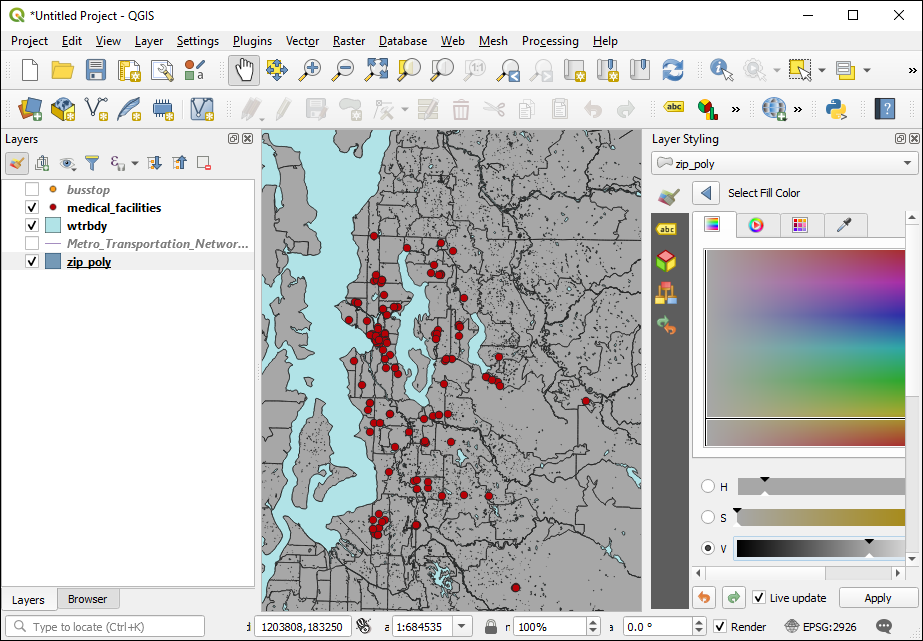
Expand all of the folders, and select the data sources you just downloaded and drag them onto the map display.
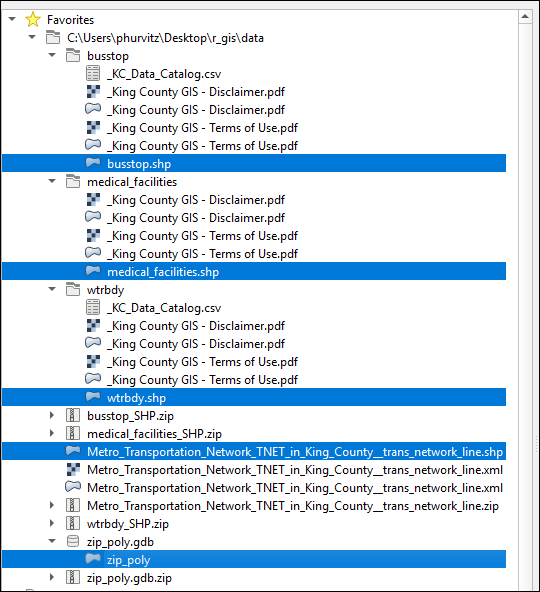
If you get dialogs for Select Datum Transformations, click OK.
![]()
The data set of ZIP code areas covers the entire US, so it may take some time to display them; to speed up the display process, R-click any of the King County layers and select Zoom to Layer.
Alter any of the layer display properties if the colors hurt your eyes.
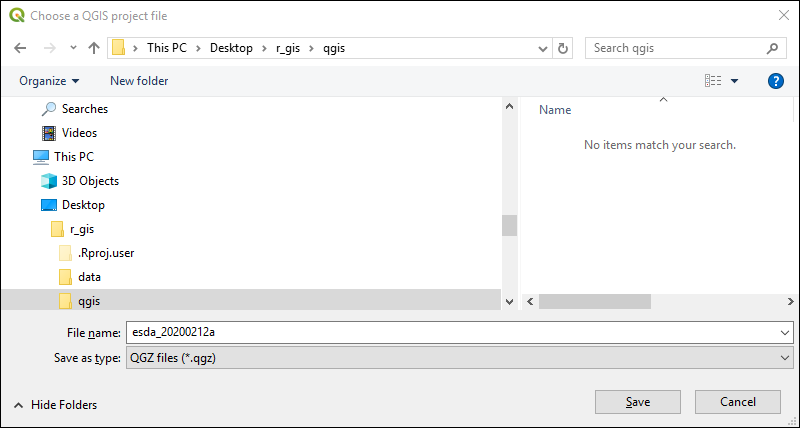
2.5 Save your project
Save the QGIS project in a new folder named qgis; Bonus: What is the significance of the file name I used?
2.6 Conclusion
Now that the preliminary steps are complete, we can move on to the remainder of the material.